

The figures are based on tests that have been carried out both in laboratories (pillar one of the Government's testing programme) and in the wider community (pillar two). The rate is expressed as the new number of new cases per 100,000 population. The list is based on the latest Public Health England figures updated on July 9 on the Government's coronavirus online dashboard. Data for the most recent three days (July 7 to 9) has been excluded as it is incomplete and likely to be revised. The list shows the rate of new cases in the seven days to July 6, followed by the equivalent figure for the previous seven days to June 29.

1. Bradford
Bradford had a rate of 35.7 in the seven days to July 6, compared to 50.1 for the previous seven days to June 29

2. Kirklees
Kirklees had a rate of 32.4 in the seven days to July 6, compared to 28.9 for the previous seven days to June 29
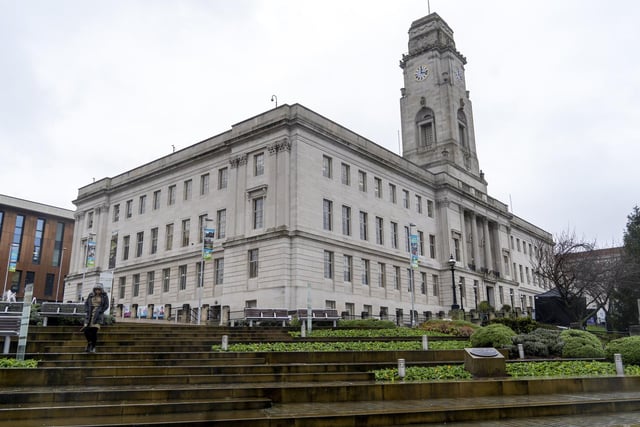
3. Barnsley
Barnsley had a rate of 17.5 in the seven days to July 6, compared to 35.1 for the previous seven days to June 29
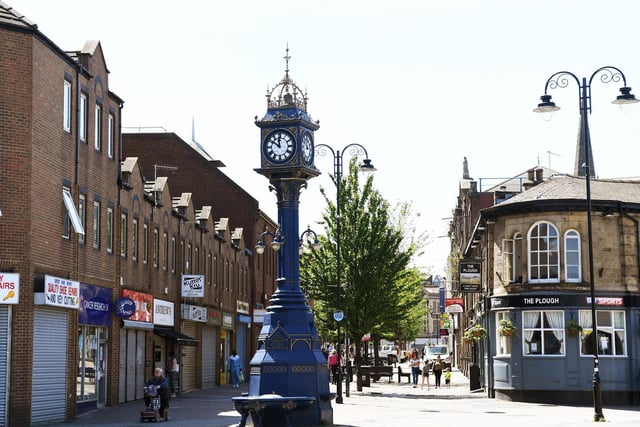
4. Rotherham
Rotherham had a rate of 16.6 in the seven days to July 6, compared to 31 for the previous seven days to June 29
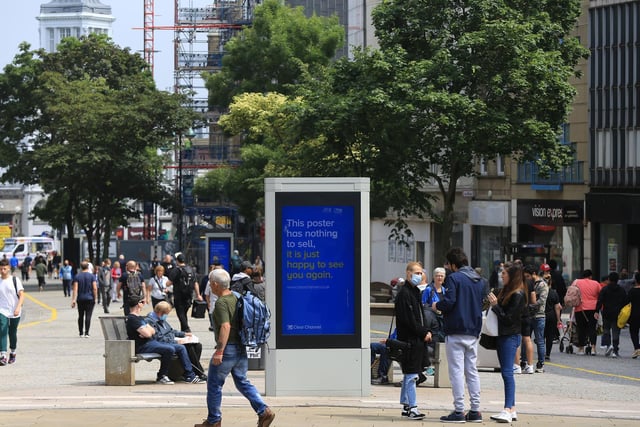
5. Sheffield
Sheffield had a rate of 14.4 in the seven days to July 6, compared to 26.3 for the previous seven days to June 29
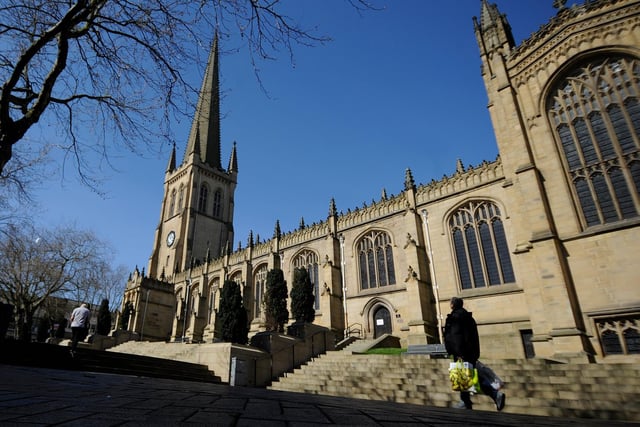
6. Wakefield
Wakefield had a rate of 14.2 in the seven days to July 6, compared to 10.1 for the previous seven days to June 29